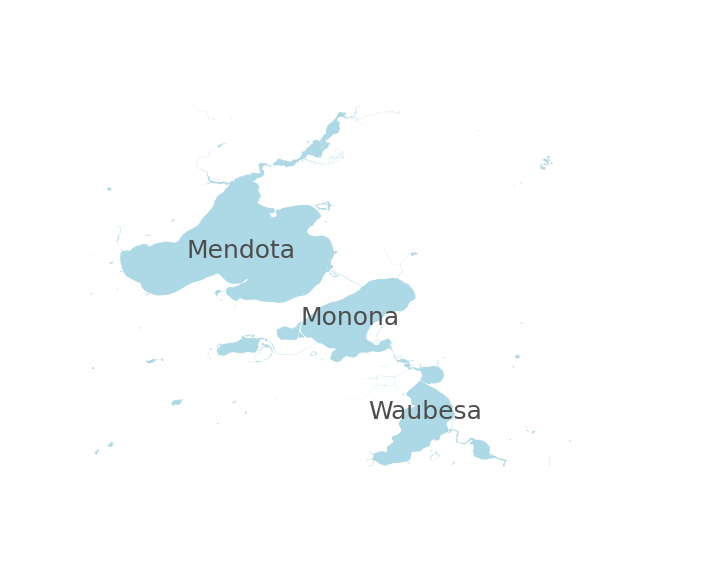
Lake Mendota, Lake Monona and Lake Waubesa are the three major Yahara lakes located in Madison, Wisconsin. Lake Wingra, a smaller
lake located
west of Lake Monona is also a part of the Yahara lake chain, but because of its size will not be included in the results
of this project. The last major
Yahara lake is Lake Kegonsa, which is located south of Madison.
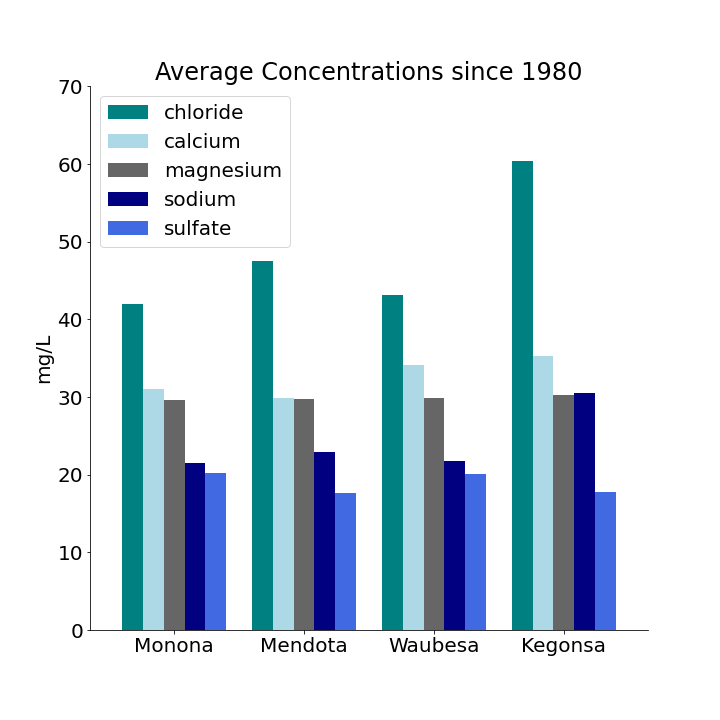
This graph shows the chemical compounds and elements that are found in highest concentrations in the Yahara Lakes. Chloride, calcium, magnesium and
sodium were the top four found in highest concentrations. Chloride levels range from 40 to 60 mg/L, calcium from 30 to 35 mg/L, magnesium levels fall
just below 30 mg/L, and sodium levels range from 20 to 30 mg/L. Unlike the top four compounds and elements, the fifth compound, sulfate, with levels
ranging from 15 to 20 mg/L, is of greater focus because of how it interacts with phosphorus. Nitrogen and phosphorus are seen in lower concentrations,
not visible on this graph, but still have serious effects in the lakes and are the elements of greatest concern because of their contributions to algae growth.
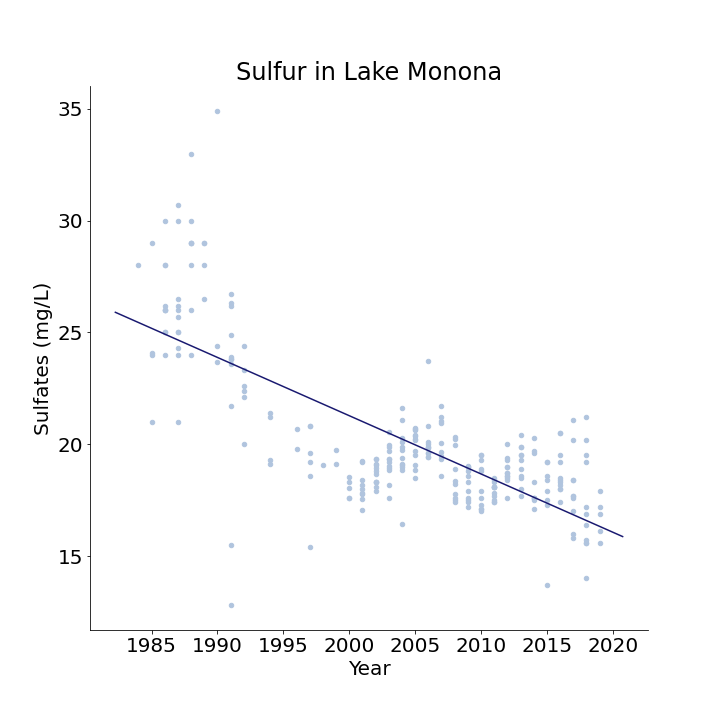
The points of this plot are measurements taken in Lake Monona of sulfate concentrations from 1984 to 2019. The trendline shows that concentrations
decreased during this time period from about 26 mg/L to 17 mg/L. It is not surprising that sulfate levels were higher in the past as copper sulfate was
used to control algae blooms until 1954. Algae blooms could have become more common because there is less sulfate to react with phosphorus, which
would stop algae blooms.
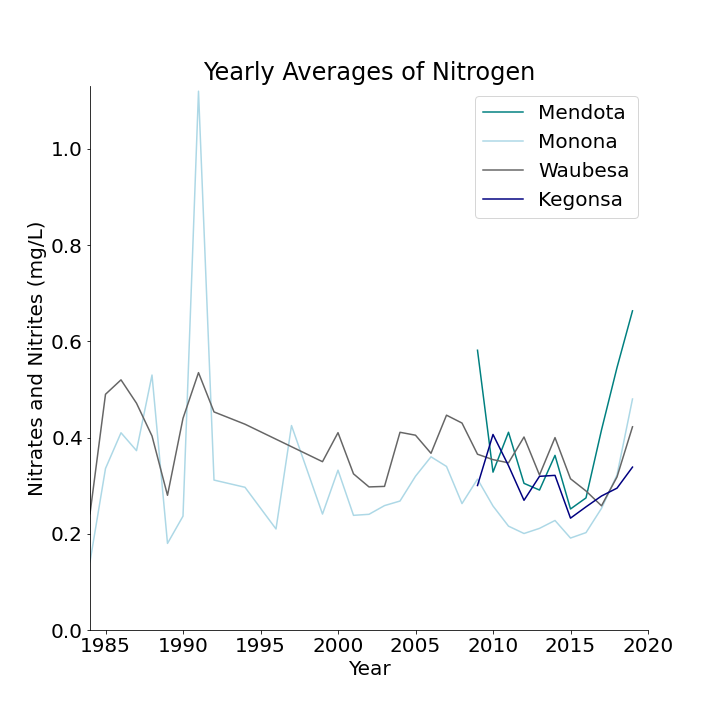
This graph shows the yearly averages of nitrates and nitrites in the Yahara Lakes from 1984 to 2019. Prior to 2009, data was only gathered for lakes Monona
and Waubesa. In 1991, N levels peaked in Monona at about 1.1 mg/L. This could be related to the explosion of Mt Pinatubo. For the most part, N levels range
from 0.2 to 0.5 mg/L. From 2015 to 2019, N levels have been increasing with Mendota having the highest average at about 0.7 mg/L and Kegonsa having the
lowest average at about 0.35 mg/L. This increase is not positive for the health of the lakes.
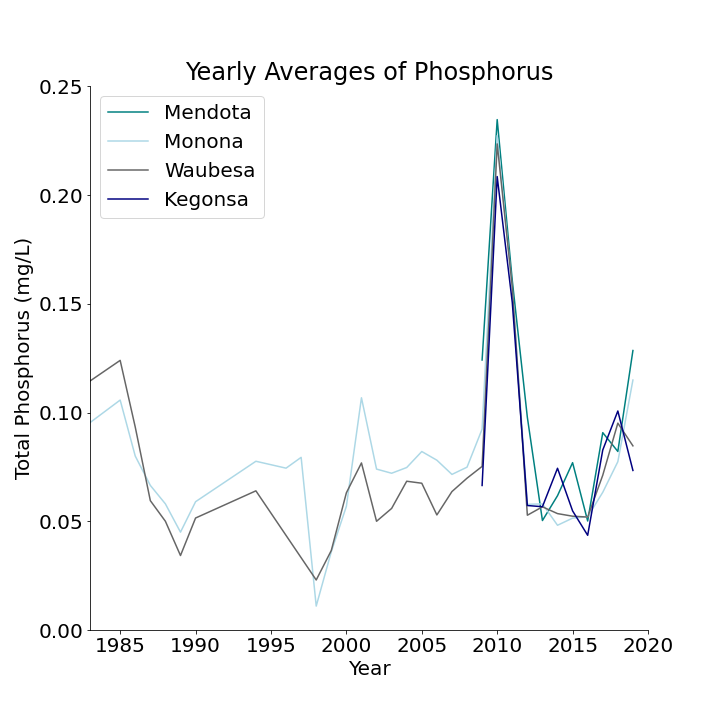
This graph shows that phosphorus levels in the Yahara Lakes were generally between 0.025 and 0.125 mg/L between the years 1984 and 2019. Around 1997,
the averages for Monona and Waubesa reached a minimum at about 0.01 and 0.02 mg/L, respectively. In 2010, the average in all four lakes peaked at around
0.24 mg/L. In recent years, P levels in Mendota and Monona have been increasing and in 2019 reached 0.14 and 0.12 mg/L. In Waubesa and Kegonsa, P levels
decreased starting in 2018 to reach about 0.09 and 0.07 mg/L.
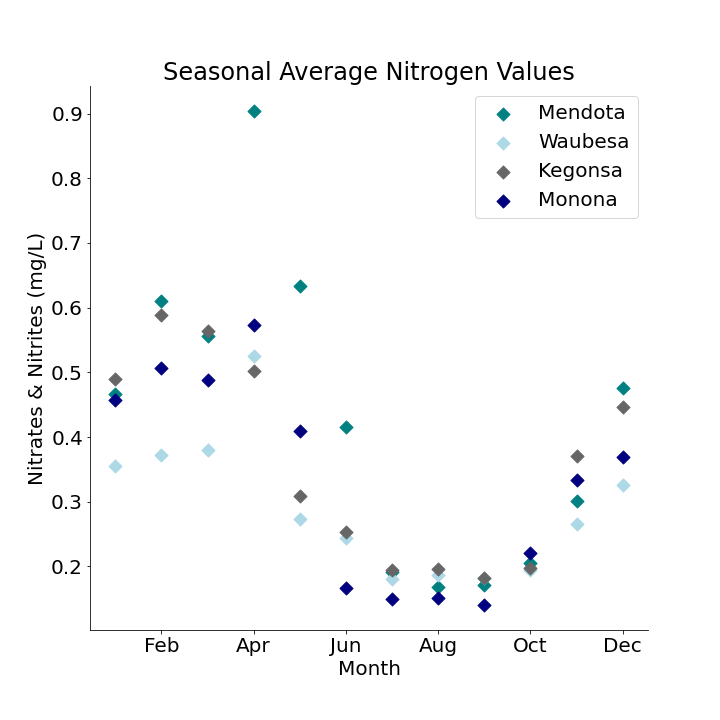
This plot shows the median levels of nitrogen in the Yahara Lakes for each month. N levels tend to be highest from January to April, ranging from about 0.35 to 0.6 mg/L.
In May, N levels begin to decrease and stay around 0.05 to 0.2 mg/L from June to September. In October, N levels begin to rise again. Nitrogen fertilizer is typically
applied from late summer through the fall, which is seen in the plot where N levels rise in October. N levels can remain high in the following months from runoff.
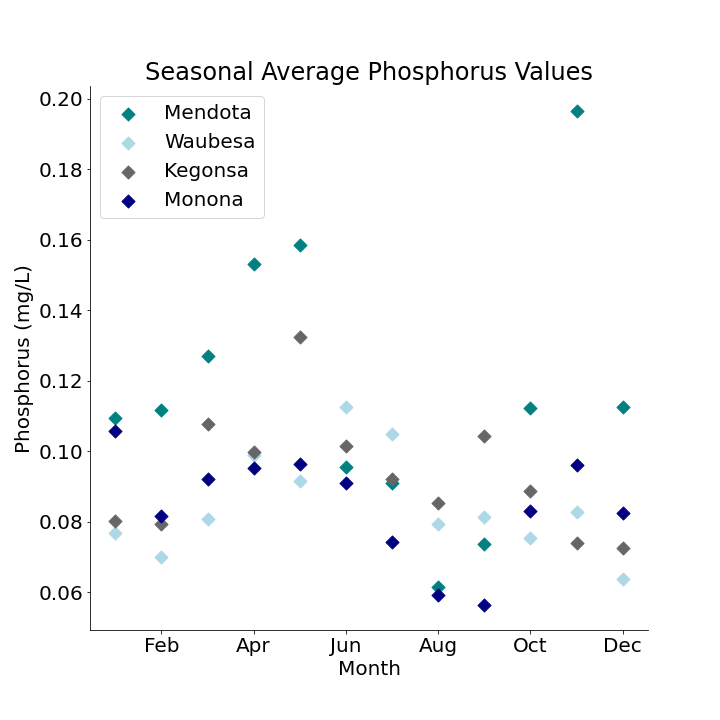
Phosphorus levels in the Yahara lakes follow a somewhat similar pattern to nitrogen levels for each month. Overall, concentration of phosphorus in the lakes is lower
than that of nitrogen, ranging from 0.05 to 0.20 mg/L. Like nitrogen, P levels are low July through September, ranging from 0.05 to about 0.10 mg/L. Levels rise in
October but decrease again December through February. It is still likely that fertilizer runoff causes higher P levels in the lakes.
This animation shows how water hardness is related to levels of calcium and magnesium in the lakes. Measurements for calcium and magnesium were not taken
between 1994 and 2004, leaving a gap in this plot. Median values were used for each year. There was a slight, but not significant increase in water hardness.
The points in this animation signify median values of conductivity each year and the line indicates the general trend for each of the four lakes. Conductivity in
the lakes is a significant measurement because dramatic changes can indicate pollution. The increase in conductivity from 1985 to 2019 was about 175 uhmos
in Monona and 225 uhmos in Waubesa. Although conductivity measurements for Mendota and Kegonsa only date back to 2010, if the conductivity trends in
these lakes were similar to those of Monona and Waubesa, the increase would have been about 200 uhmos in Mendota and 275 uhmos in Kegonsa. Since these
changes were gradual, it is likely that any pollution causing the changes happened over time.
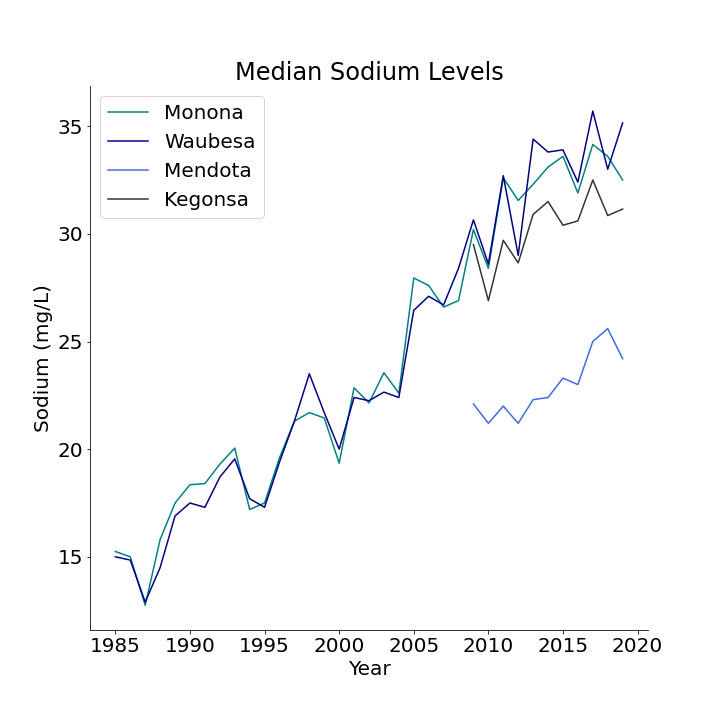
Sodium is one of several factors that affect conductivity. This plot shows that sodium levels in Monona and Waubesa increased from about 15 mg/L to 35 mg/L
over the past 35 years. Similar increases are seen in Mendota and Kegonsa but measurements only go back about 10 years. One possible explanation for this
increase is road salt dissolving and reaching the lakes. It is likely that the increase in sodium levels caused conductivity levels to increase.